|
|
HOME |
|
SEARCH SALARIES
Advertising
|
CHICAGO / SALARY
|
||||||||||||||||||||||||||||||||||||||||||||||||||||||||||||||||||||||||||||||||||||||||||||||||||||||||||||||||||||||||||||||||||||||||||||
SALARY SURVEYS
795 |
UPDATED April 2024 About salary data? |
CALCULATE YOUR OPTIMUM SALARY!
(based on your career and experience) |
| AVERAGE SALARY / YEAR | MOST TYPICAL SALARY / YEAR |
Gross income
Net (after tax)
|
||
$86,309 USD£67,789 GBPNew York City $100,635 USD |
$52,000 USD£40,841 GBP |
Average salary in Chicago is $86,309 USD per year. The most typical earning is $52,000 USD. All data are based on 795 salary surveys. Salaries are different between men and women. Men receive an average salary of $95,900 USD. Women receive a salary of $76,300 USD.
The most paid careers are Engineers & Technicians V with average income $131,700 USD and Engineers & Technicians III with income $120,000 USD.
Based on education, the highest salaries receive people with Doctorate Degree with salary of $147,200 USD. The second most paid education level is Masters Degree with salary of $99,000 USD.
Different experiences affect earning as well. People with 20+ Years of experience receive salary of $116,600 USD. Employees with 12-16 Years of experience receive $100,800 USD.
| Salary Levels (USD) per Year | Surveys | [%] |
|---|---|---|
|
$10,000 USD -
$14,999 USD
|
0 |
n/a
|
|
$15,000 USD -
$19,999 USD
|
4 |
100%
0.5% |
|
$20,000 USD -
$24,999 USD
|
18 |
99.5%
2.26% |
|
$25,000 USD -
$29,999 USD
|
21 |
97.23%
2.64% |
|
$30,000 USD -
$34,999 USD
|
31 |
94.59%
3.9% |
|
$35,000 USD -
$39,999 USD
|
20 |
90.69%
2.52% |
|
$40,000 USD -
$44,999 USD
|
40 |
88.18%
5.03% |
|
$45,000 USD -
$49,999 USD
|
44 |
83.14%
5.53% |
| THE MOST TYPICAL SALARY | ||
|
$50,000 USD -
$54,999 USD
|
68 |
77.61%
8.55% |
|
$55,000 USD -
$59,999 USD
|
43 |
69.06%
5.41% |
|
$60,000 USD -
$64,999 USD
|
48 |
63.65%
6.04% |
|
$65,000 USD -
$69,999 USD
|
34 |
57.61%
4.28% |
|
$70,000 USD -
$74,999 USD
|
43 |
53.33%
5.41% |
|
$75,000 USD -
$79,999 USD
|
26 |
47.92%
3.27% |
|
$80,000 USD -
$84,999 USD
|
40 |
44.65%
5.03% |
|
$85,000 USD -
$89,999 USD
|
25 |
39.62%
3.14% |
|
$90,000 USD -
$94,999 USD
|
28 |
36.48%
3.52% |
|
$95,000 USD -
$99,999 USD
|
21 |
32.96%
2.64% |
|
$100,000 USD -
$104,999 USD
|
30 |
30.31%
3.77% |
|
$105,000 USD -
$109,999 USD
|
10 |
26.54%
1.26% |
|
$110,000 USD -
$114,999 USD
|
19 |
25.28%
2.39% |
|
$115,000 USD -
$119,999 USD
|
9 |
22.89%
1.13% |
|
$120,000 USD -
$124,999 USD
|
30 |
21.76%
3.77% |
|
$125,000 USD -
$129,999 USD
|
12 |
17.99%
1.51% |
|
$130,000 USD -
$134,999 USD
|
12 |
16.48%
1.51% |
|
$135,000 USD -
$139,999 USD
|
7 |
14.97%
0.88% |
|
$140,000 USD -
$144,999 USD
|
17 |
14.09%
2.14% |
|
$145,000 USD -
$149,999 USD
|
5 |
11.95%
0.63% |
| HIGH SALARIES | ||
|
$150,000 USD -
$159,999 USD
|
18 |
11.32%
2.26% |
|
$160,000 USD -
$169,999 USD
|
5 |
9.06%
0.63% |
|
$170,000 USD -
$179,999 USD
|
9 |
8.43%
1.13% |
|
$180,000 USD -
$189,999 USD
|
6 |
7.3%
0.75% |
|
$190,000 USD -
$199,999 USD
|
5 |
6.54%
0.63% |
|
$200,000 USD -
$209,999 USD
|
13 |
5.91%
1.64% |
|
$210,000 USD -
$219,999 USD
|
4 |
4.28%
0.5% |
|
$220,000 USD -
$229,999 USD
|
6 |
3.77%
0.75% |
|
$230,000 USD -
$239,999 USD
|
2 |
3.02%
0.25% |
|
$240,000 USD -
$249,999 USD
|
2 |
2.77%
0.25% |
|
$250,000 USD -
$349,999 USD
|
20 |
2.52%
2.52% |
Education / Chicago (Gross USD)
|
||||||||||||||||||||||||||||||||||||||||||||||||||||||||||||||||||||||||||||||||||||||||||||||||||||||||||||||||||||||||||||||||||||||||||||||||||||||||||||||||||||||||||||||||||||||||||||||||||||||||||||||||||||||||||||||||||||||||||||||||||||||||||||||||||||||||||||||||||||||||||||||||||||||||||||||||||||||||||||||||||||||||||||||||||||||||||||||||||||||||||||||||||||||||||||||||||||||||||||||||||||||||||||||||||||||||||||||||||||||||||||||||||||||||||||||||||||||||||||||||||||||||||||||||||||||
Experience / Chicago (Gross USD)
|
||||||||||||||||||||||||||||||||||||||||||||||||||||||||||||||||||||||||||||||||||||||||||||||||||||||||||||||||||||||||||||||||||||||||||||||||||||||||||||||||||||||||||||||||||||||||||||||||||||||||||||||||||||||||||||||||||||||||||||||||||||||||||||||||||||||||||||||||||||||||||||||||||||||||||||||||||||||||||||||||||||||||||||||||||||||||||||||||||||||||||||||||||||||||||||||||||||||||||||||||||||||||||||||||||||||||||||||||||||||||||||||||||||||||||||||||||||||||||||||||||||||||||||||||||||||
Age / Chicago (Gross USD)
|
||||||||||||||||||||||||||||||||||||||||||||||||||||||||||||||||||||||||||||||||||||||||||||||||||||||||||||||||||||||||||||||||||||||||||||||||||||||||||||||||||||||||||||||||||||||||||||||||||||||||||||||||||||||||||||||||||||||||||||||||||||||||||||||||||||||||||||||||||||||||||||||||||||||||||||||||||||||||||||||||||||||||||||||||||||||||||||||||||||||||||||||||||||||||||||||||||||||||||||||||||||||||||||||||||||||||||||||||||||||||||||||||||||||||||||||||||||||||||||||||||||||||||||||||||||||
Work Type / Chicago (Gross USD)
|
||||||||||||||||||||||||||||||||||||||||||||||||||||||||||||||||||||||||||||||||||||||||||||||||||||||||||||||||||||||||||||||||||||||||||||||||||||||||||||||||||||||||||||||||||||||||||||||||||||||||||||||||||||||||||||||||||||||||||||||||||||||||||||||||||||||||||||||||||||||||||||||||||||||||||||||||||||||||||||||||||||||||||||||||||||||||||||||||||||||||||||||||||||||||||||||||||||||||||||||||||||||||||||||||||||||||||||||||||||||||||||||||||||||||||||||||||||||||||||||||||||||||||||||||||||||
Career Groups / Chicago (Gross USD) |
||||||||||||||||||||||||||||||||||||||||||||||||||||||||||||||||||||||||||||||||||||||||||||||||||||||||||||||||||||||||||||||||||||||||||||||||||||||||||||||||||||||||||||||||||||||||||||||||||||||||||||||||||||||||||||||||||||||||||||||||||||||||||||||||||||||||||||||||||||||||||||||||||||||||||||||||||||||||||||||||||||||||||||||||||||||||||||||||||||||||||||||||||||||||||||||||||||||||||||||||||||||||||||||||||||||||||||||||||||||||||||||||||||||||||||||||||||||||||||||||||||||||||||||||||||||
Careers / Chicago (Gross USD)
|
||||||||||||||||||||||||||||||||||||||||||||||||||||||||||||||||||||||||||||||||||||||||||||||||||||||||||||||||||||||||||||||||||||||||||||||||||||||||||||||||||||||||||||||||||||||||||||||||||||||||||||||||||||||||||||||||||||||||||||||||||||||||||||||||||||||||||||||||||||||||||||||||||||||||||||||||||||||||||||||||||||||||||||||||||||||||||||||||||||||||||||||||||||||||||||||||||||||||||||||||||||||||||||||||||||||||||||||||||||||||||||||||||||||||||||||||||||||||||||||||||||||||||||||||||||||
People's individual salary examples (surveys)
Enhance Due Diligence Analyst
Posted 11 January 2024
Assisstant Engineer
Posted 11 July 2023
Customer Success Manager
Posted 10 September 2022
Executive Supply Chain
Posted 21 July 2022
Supply Chain Analyst
Posted 20 July 2022
Area Manager
Posted 18 July 2022
Administration Support
Posted 11 July 2022
Data Scientist
Posted 15 June 2022
Marketing Manager
Posted 13 June 2022
Data Analyst
Posted 28 May 2022
Account Manager
Posted 15 April 2022
Customer Support
Posted 08 April 2022
Hr Director
Posted 07 April 2022
Director
Posted 21 March 2022
Recepcionista
Posted 21 March 2022
Animator
Posted 18 March 2022
Professor Emeritus
Posted 11 March 2022
Product Manager
Posted 15 February 2022
Team Lead
Posted 15 January 2022
Product Manager
Posted 13 January 2022
Talent Acquisition & Strategy
Posted 13 January 2022
Mechanical Insulator
Posted 11 January 2022
Client Development - Manager
Posted 06 January 2022
Investor Relations
Posted 29 December 2021
Lead Application Developer
Posted 28 December 2021
Account Executive
Posted 26 December 2021
System Administrator
Posted 23 November 2021
Accountant
Posted 16 November 2021
Expert
Posted 09 November 2021
Underwriter/asset Manager
Posted 27 October 2021
Senior Sw Engineer
Posted 11 October 2021
Attorney
Posted 02 October 2021
Electrical Engineer
Posted 24 September 2021
Lecturer
Posted 22 September 2021
Software Engineer
Posted 21 September 2021
Account Manager
Posted 14 July 2021
Hr Manager
Posted 08 July 2021
Senior Global Research Operations Manager
Posted 23 June 2021
Middle Mangement
Posted 12 March 2021
Lead Sda
Posted 17 February 2021
Director Of Teacher Support
Posted 14 January 2021
Senior Engineer L1
Posted 11 December 2020
Loan Officer
Posted 10 December 2020
Roofer
Posted 22 November 2020
Sales Engineer
Posted 08 November 2020
Pharmacy Technician
Posted 17 October 2020
Sales Manager
Posted 13 October 2020
Delivery Manager
Posted 11 October 2020
Land Lord
Posted 22 September 2020
Security Executive
Posted 11 September 2020
|
||||||||||||||||||||||||||||||||||||||||||||||||||||||||||||||||||||||||||||||||||||||||||||||||||||||||||||||||||||||||||||||||||||||||||||||||||||||||||||||||||||||||||||||||||||||||||||||||||||||||||||||||||||||||||||||||||||||||||||||||||||||||||||||||||||||||||||||||||||||||||||||||||||||||||||||||||||||||||||||||||||||||||||||||||||||||||||||||||||||||||||||||||||||||||||||||||||||||||||||||||||||||||||||||||||||||||||||||||||||||||||||||||||||||||||||||||||||||||||||||||||||||||||||||||||||
ECONOMY / ChicagoThe economy in Chicago is among largest on the world and very diversified. It is an efficient economic center for more than 400 major headquarters. Chicago has various economic sectors that include manufacturing, risk management and innovations, IT, health services, and others. Chicago Employment by Industry 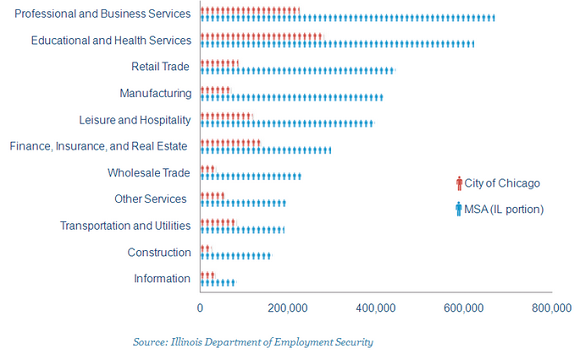
Average salary in Chicago is much higher than U.S. average salary. For example Experienced Software Developer earn around $87,000 on average per year. Average salary for IT Project Manager in Chicago is around $88,000. Executive Assistant earn around $51,000 on average per year. |
|
© www.averagesalarysurvey.com
2011 - 2024 |
Home
·
About ·
Privacy policy ·
Site map ·
Xml ·
PT ·
ES ·
IT ·
DE ·
SL ·
AR · BG · ZH · HR · CS · DA · NL · ET · FI · EL · HU · IS · ID · GA · JA · KO · LV · LT · MK · NO · PL · RO · RU · SR · SK · SV · TR · UK · CY |