|
|
HOME |
|
SEARCH SALARIES
Advertising
|
BOSTON / SALARY
|
||||||||||||||||||||||||||||||||||||||||||||||||||||||||||||||||||||||||||||||||||||||||||||||||||||||||||||||||||||||||||||||||||||||||||||
SALARY SURVEYS
647 |
UPDATED April 2024 About salary data? |
CALCULATE YOUR OPTIMUM SALARY!
(based on your career and experience) |
| AVERAGE SALARY / YEAR | MOST TYPICAL SALARY / YEAR |
Gross income
Net (after tax)
|
||
$94,018 USD£73,843 GBPNew York City $100,635 USD |
$52,000 USD£40,841 GBP |
Average salary in Boston is $94,018 USD per year. The most typical earning is $52,000 USD. All data are based on 647 salary surveys. Salaries are different between men and women. Men receive an average salary of $110,000 USD. Women receive a salary of $75,600 USD.
The most paid careers are Archaeology & History with average income $220,000 USD and Engineers & Technicians IV with income $135,000 USD.
Based on education, the highest salaries receive people with Doctorate Degree with salary of $131,900 USD. The second most paid education level is Masters Degree with salary of $106,700 USD.
Different experiences affect earning as well. People with 20+ Years of experience receive salary of $120,700 USD. Employees with 16-20 Years of experience receive $117,900 USD.
| Salary Levels (USD) per Year | Surveys | [%] |
|---|---|---|
|
$10,000 USD -
$14,999 USD
|
2 |
100%
0.31% |
|
$15,000 USD -
$19,999 USD
|
1 |
99.69%
0.15% |
|
$20,000 USD -
$24,999 USD
|
9 |
99.54%
1.39% |
|
$25,000 USD -
$29,999 USD
|
11 |
98.15%
1.7% |
|
$30,000 USD -
$34,999 USD
|
22 |
96.45%
3.4% |
|
$35,000 USD -
$39,999 USD
|
27 |
93.04%
4.17% |
|
$40,000 USD -
$44,999 USD
|
22 |
88.87%
3.4% |
|
$45,000 USD -
$49,999 USD
|
27 |
85.47%
4.17% |
| THE MOST TYPICAL SALARY | ||
|
$50,000 USD -
$54,999 USD
|
41 |
81.3%
6.34% |
|
$55,000 USD -
$59,999 USD
|
29 |
74.96%
4.48% |
|
$60,000 USD -
$64,999 USD
|
33 |
70.48%
5.1% |
|
$65,000 USD -
$69,999 USD
|
27 |
65.38%
4.17% |
|
$70,000 USD -
$74,999 USD
|
25 |
61.21%
3.86% |
|
$75,000 USD -
$79,999 USD
|
32 |
57.34%
4.95% |
|
$80,000 USD -
$84,999 USD
|
27 |
52.4%
4.17% |
|
$85,000 USD -
$89,999 USD
|
29 |
48.22%
4.48% |
|
$90,000 USD -
$94,999 USD
|
23 |
43.74%
3.55% |
|
$95,000 USD -
$99,999 USD
|
17 |
40.19%
2.63% |
|
$100,000 USD -
$104,999 USD
|
38 |
37.56%
5.87% |
|
$105,000 USD -
$109,999 USD
|
10 |
31.68%
1.55% |
|
$110,000 USD -
$114,999 USD
|
19 |
30.14%
2.94% |
|
$115,000 USD -
$119,999 USD
|
8 |
27.2%
1.24% |
|
$120,000 USD -
$124,999 USD
|
24 |
25.97%
3.71% |
|
$125,000 USD -
$129,999 USD
|
12 |
22.26%
1.85% |
|
$130,000 USD -
$134,999 USD
|
14 |
20.4%
2.16% |
|
$135,000 USD -
$139,999 USD
|
3 |
18.24%
0.46% |
|
$140,000 USD -
$144,999 USD
|
10 |
17.77%
1.55% |
|
$145,000 USD -
$149,999 USD
|
5 |
16.23%
0.77% |
| HIGH SALARIES | ||
|
$150,000 USD -
$159,999 USD
|
26 |
15.46%
4.02% |
|
$160,000 USD -
$169,999 USD
|
10 |
11.44%
1.55% |
|
$170,000 USD -
$179,999 USD
|
11 |
9.89%
1.7% |
|
$180,000 USD -
$189,999 USD
|
8 |
8.19%
1.24% |
|
$190,000 USD -
$199,999 USD
|
3 |
6.96%
0.46% |
|
$200,000 USD -
$209,999 USD
|
9 |
6.49%
1.39% |
|
$210,000 USD -
$219,999 USD
|
3 |
5.1%
0.46% |
|
$220,000 USD -
$229,999 USD
|
6 |
4.64%
0.93% |
|
$230,000 USD -
$239,999 USD
|
2 |
3.71%
0.31% |
|
$240,000 USD -
$249,999 USD
|
2 |
3.4%
0.31% |
|
$250,000 USD -
$349,999 USD
|
20 |
3.09%
3.09% |
Education / Boston (Gross USD)
|
||||||||||||||||||||||||||||||||||||||||||||||||||||||||||||||||||||||||||||||||||||||||||||||||||||||||||||||||||||||||||||||||||||||||||||||||||||||||||||||||||||||||||||||||||||||||||||||||||||||||||||||||||||||||||||||||||||||||||||||||||||||||||||||||||||||||||||||||||||||||||||||||||||||||||||||||||||||||||||||||||||||||||||||||||||||||||||||||||||||||||||||||||||||||||||||||||||||||||||||||||||||||||||||||||||||||||||||||||||||||||||||||||||||||||||||||||||||||||||||||||||||||||||||||||||||
Experience / Boston (Gross USD)
|
||||||||||||||||||||||||||||||||||||||||||||||||||||||||||||||||||||||||||||||||||||||||||||||||||||||||||||||||||||||||||||||||||||||||||||||||||||||||||||||||||||||||||||||||||||||||||||||||||||||||||||||||||||||||||||||||||||||||||||||||||||||||||||||||||||||||||||||||||||||||||||||||||||||||||||||||||||||||||||||||||||||||||||||||||||||||||||||||||||||||||||||||||||||||||||||||||||||||||||||||||||||||||||||||||||||||||||||||||||||||||||||||||||||||||||||||||||||||||||||||||||||||||||||||||||||
Age / Boston (Gross USD)
|
||||||||||||||||||||||||||||||||||||||||||||||||||||||||||||||||||||||||||||||||||||||||||||||||||||||||||||||||||||||||||||||||||||||||||||||||||||||||||||||||||||||||||||||||||||||||||||||||||||||||||||||||||||||||||||||||||||||||||||||||||||||||||||||||||||||||||||||||||||||||||||||||||||||||||||||||||||||||||||||||||||||||||||||||||||||||||||||||||||||||||||||||||||||||||||||||||||||||||||||||||||||||||||||||||||||||||||||||||||||||||||||||||||||||||||||||||||||||||||||||||||||||||||||||||||||
Work Type / Boston (Gross USD)
|
||||||||||||||||||||||||||||||||||||||||||||||||||||||||||||||||||||||||||||||||||||||||||||||||||||||||||||||||||||||||||||||||||||||||||||||||||||||||||||||||||||||||||||||||||||||||||||||||||||||||||||||||||||||||||||||||||||||||||||||||||||||||||||||||||||||||||||||||||||||||||||||||||||||||||||||||||||||||||||||||||||||||||||||||||||||||||||||||||||||||||||||||||||||||||||||||||||||||||||||||||||||||||||||||||||||||||||||||||||||||||||||||||||||||||||||||||||||||||||||||||||||||||||||||||||||
Career Groups / Boston (Gross USD) |
||||||||||||||||||||||||||||||||||||||||||||||||||||||||||||||||||||||||||||||||||||||||||||||||||||||||||||||||||||||||||||||||||||||||||||||||||||||||||||||||||||||||||||||||||||||||||||||||||||||||||||||||||||||||||||||||||||||||||||||||||||||||||||||||||||||||||||||||||||||||||||||||||||||||||||||||||||||||||||||||||||||||||||||||||||||||||||||||||||||||||||||||||||||||||||||||||||||||||||||||||||||||||||||||||||||||||||||||||||||||||||||||||||||||||||||||||||||||||||||||||||||||||||||||||||||
Careers / Boston (Gross USD)
|
||||||||||||||||||||||||||||||||||||||||||||||||||||||||||||||||||||||||||||||||||||||||||||||||||||||||||||||||||||||||||||||||||||||||||||||||||||||||||||||||||||||||||||||||||||||||||||||||||||||||||||||||||||||||||||||||||||||||||||||||||||||||||||||||||||||||||||||||||||||||||||||||||||||||||||||||||||||||||||||||||||||||||||||||||||||||||||||||||||||||||||||||||||||||||||||||||||||||||||||||||||||||||||||||||||||||||||||||||||||||||||||||||||||||||||||||||||||||||||||||||||||||||||||||||||||
People's individual salary examples (surveys)
Senior Scientist
Posted 09 September 2022
Electrical Engineer
Posted 08 September 2022
Marketing And Development Director
Posted 25 July 2022
Audit
Posted 25 July 2022
Vice President
Posted 17 June 2022
Barista
Posted 16 June 2022
Data Scientist
Posted 15 June 2022
Captain
Posted 14 June 2022
Registered Nurse
Posted 12 June 2022
Security Manager
Posted 09 June 2022
Ecommerce Merchandisingmanager
Posted 08 June 2022
Director Strategy
Posted 14 April 2022
Postdoc
Posted 08 April 2022
Intern
Posted 06 April 2022
Continuing Education Teacher
Posted 21 March 2022
Architect Ii
Posted 09 March 2022
Actuary
Posted 06 March 2022
Owner And Ceo
Posted 03 March 2022
Primary Developer
Posted 21 February 2022
Manager
Posted 14 February 2022
System Architect
Posted 17 January 2022
Controller
Posted 16 January 2022
Chief Scientific Officer
Posted 15 January 2022
Designer
Posted 02 January 2022
Automobile Damage Appraiser
Posted 02 January 2022
Data Architect And Manager
Posted 24 November 2021
Chief Financial Officer
Posted 20 November 2021
Consultant
Posted 18 November 2021
Lead Salesman
Posted 17 November 2021
Fp&a Analyst
Posted 17 November 2021
It Compliance Analyst
Posted 30 October 2021
Mechanical Engineer I
Posted 19 October 2021
Postdoc
Posted 23 September 2021
Software Engineer
Posted 17 September 2021
Senior Lead Network Engineer
Posted 15 September 2021
It Manager
Posted 25 August 2021
Professor Of Computer Science
Posted 17 August 2021
Mechanic
Posted 14 March 2021
Project Manager
Posted 04 March 2021
Principal Enginner
Posted 10 February 2021
Project Engineer
Posted 25 December 2020
Analyst
Posted 01 November 2020
Orthodontist
Posted 17 October 2020
Analyst
Posted 19 September 2020
Restaurant
Posted 14 September 2020
First Officer
Posted 27 July 2020
Accounting Manager
Posted 08 June 2020
Comp Sci
Posted 25 May 2020
Architecture
Posted 23 May 2020
Mechanic
Posted 12 May 2020
|
||||||||||||||||||||||||||||||||||||||||||||||||||||||||||||||||||||||||||||||||||||||||||||||||||||||||||||||||||||||||||||||||||||||||||||||||||||||||||||||||||||||||||||||||||||||||||||||||||||||||||||||||||||||||||||||||||||||||||||||||||||||||||||||||||||||||||||||||||||||||||||||||||||||||||||||||||||||||||||||||||||||||||||||||||||||||||||||||||||||||||||||||||||||||||||||||||||||||||||||||||||||||||||||||||||||||||||||||||||||||||||||||||||||||||||||||||||||||||||||||||||||||||||||||||||||
ECONOMY / BostonThe 4 largest industries among Boston's employers are health care, financial services, insurance, and education. The health care industry in Boston employ far more employees than any other sector. More than 50% of Boston’s employees at largest companies have at least a four year college degree. The 4 largest employers in Boston are Massachusetts General Hospital, Brigham and Women's Hospital, Fidelity Investments (FMR Corp., and Boston University. Unemployment rate in Boston 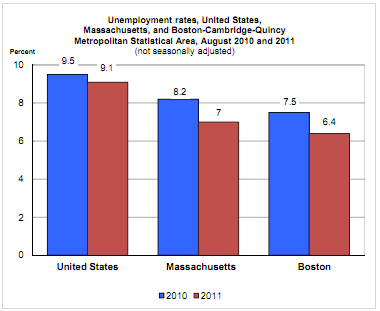
Average salary in Boston is much higher than national average salary. For example Senior Software Developer in Boston earn around $95,000 on average per year. Executive Assistant earn around $54,000 on average per year. |
|
© www.averagesalarysurvey.com
2011 - 2024 |
Home
·
About ·
Privacy policy ·
Site map ·
Xml ·
PT ·
ES ·
IT ·
DE ·
SL ·
AR · BG · ZH · HR · CS · DA · NL · ET · FI · EL · HU · IS · ID · GA · JA · KO · LV · LT · MK · NO · PL · RO · RU · SR · SK · SV · TR · UK · CY |